Metrics
Metrics (Analytics) is where everything else gets measured: how many leads came in, how many turned into sales, how long your team takes to reply and how well it serves. The data comes from Smart Chat, Funnels, CDP and Calendar.
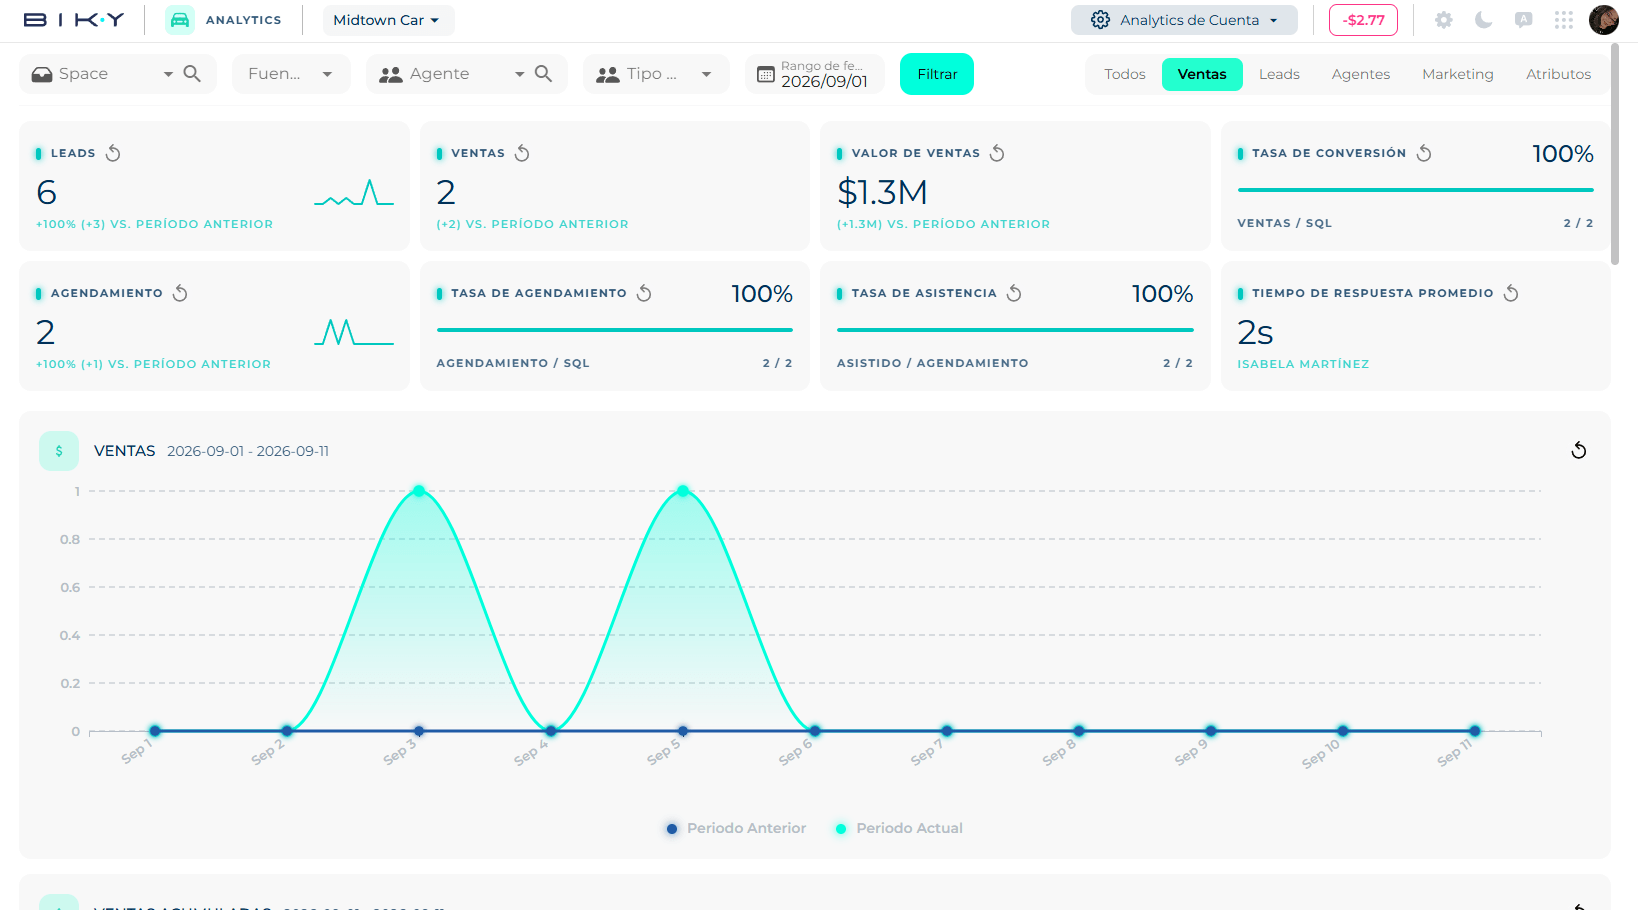
The four views
The header selector switches views:
| View | What it shows |
|---|---|
| Account Analytics | Your account's performance. The default view and the one used day to day. |
| Global Analytics | The same aggregated across several accounts, for groups with more than one operation. |
| Billing Metrics | Consumption and billing. See Billing. |
| AI Analysis | Deep analysis of conversations with AI. See below. |
Filters
The top bar filters everything shown below:
- Space — the area or branch.
- Sources — where the lead came from.
- Agent — an advisor or the AI agent.
- Agent type — Digital (the agent and chat advisors) or Floor (in-person service).
- Date range.
Filter applies the changes.
The range defines the comparison
Almost every indicator shows vs. previous period: if you pick September 1 to 11, the comparison is against the previous 11 days. To compare full months, pick full months.
Main indicators
Always visible at the top, each with its variation against the previous period:
| Indicator | What it measures |
|---|---|
| Leads | New contacts in the period. |
| Sales | Won opportunities. |
| Sales value | The total amount of those sales. |
| Conversion rate | Sales / SQL — of the qualified leads, how many bought. |
| Scheduling | Appointments booked. |
| Scheduling rate | Scheduling / SQL. |
| Show rate | Attended / Scheduling — of those who booked, how many came. |
| Average response time | How long a customer waits for a reply. Below it, who has the best. |
The full chain
Leads → SQL → Scheduling → Attendance → Sale. Each rate measures one jump in that chain. When sales drop, the first job is to find which jump they are falling at, not to stare at the total.
AI Analysis
A separate view that processes conversations with AI to draw conclusions deeper than a count.
- Filter by Room ID (a specific conversation), Space and Date range.
- Choose the Limit of conversations to process.
- Start New Analysis.
The Analysis processes table lists each run with Process ID, Status, Rooms, Processed, Errors, Started, Last update, the resulting Report and the Filters you used.
In this section
- The tabs: what is in Sales, Leads, Agents, Marketing and Attributes.
- Biky dictionary → Metrics: what each acronym and indicator on these dashboards measures.